Слайд 1SPREADSHEETS EXCEL 2010
Слайд 2Spreadsheet
A spreadsheet is an interactive computer application program for organization and analysis of information in tabular form. Spreadsheets developed as computerized simulations of paper accounting worksheets.
Слайд 3The program operates on data represented as cells of an array, organized in rows and columns. Each cell of the array is a model–view–controller element that can contain either numeric or text data, or the results of formulas that automatically calculate and display a value based on the contents of other cells.
Слайд 4The user of the spreadsheet can make changes in any stored value and observe the effects on calculated values. This makes the spreadsheet useful for "what-if" analysis since many cases can be rapidly investigated without tedious manual recalculation. Modern spreadsheet software can have multiple interacting sheets, and can display data either as text and numerals, or in graphical form.
Слайд 5In addition to the fundamental operations of arithmetic and mathematical functions, modern spreadsheets provide built-in functions for common financial and statistical operations. Such calculations as net present value or standard deviation can be applied to tabular data with a pre-programmed function in a formula. Spreadsheet programs also provide conditional expressions, functions to convert between text and numbers, and functions that operate on strings of text.
Слайд 6Spreadsheets have now replaced paper-based systems throughout the business world. Although they were first developed for accounting or bookkeeping tasks, they now are used extensively in any context where tabular lists are built, sorted, and shared.
Слайд 7First spreadsheet
VisiCalc was the first electronic spreadsheet on a microcomputer, and it helped turn the Apple II computer into a popular and widely used system (1979). For IBM PC in 1981.
Слайд 8Screenshot of VisiCalc
Слайд 9MS-DOS
Lotus 1-2-3 (1983) was the leading spreadsheet when DOS was the dominant operating system, was written specially for IBM PC => good performance. The first “killer application”
Слайд 11Other MS-DOS spreadsheets
Borland Quattro that replaced VisiCalc.
Слайд 12Now
Excel now has the largest market share on the Windows and Macintosh platforms. A spreadsheet program is a standard feature of an office productivity suite; since the advent of web apps, office suites now also exist in web app form.
Слайд 13Microsoft Excel
Since the mid 1990s Excel has been the domineering commercial electronic spreadsheet.
Слайд 14Open source software
Gnumeric is a free, cross-platform spreadsheet program that is part of the GNOME Free Software Desktop Project. OpenOffice.org Calc and the very closely related LibreOffice Calc are free and open-source spreadsheets.
Слайд 15openOffice.org Calc spreadsheet
Слайд 16Web-based spreadsheets
Office Web Apps Google Spreadsheets They have real-time updates from remote sources such as stock prices and currency exchange rates.
Слайд 17Google spreadsheet
Слайд 18Excel 2010
Organize financial information Perform calculations Display results in different ways
Слайд 19
Слайд 20
Слайд 21Entering the data
You can start with a template or begin with a blank worksheet, then
Слайд 22
Слайд 23More sources
You can also import data from a text file, a Web source MS Access database In this case you click the Data tab and click your choice in the Get External Data group, then navigate to the file you want to use and click Open to add your data at the selected cell.
Слайд 24Some facts
Number of rows 1 048 576 Number of columns 16 385 Width of column 255 characters Number of colours 16 mln
Слайд 25Editing data
Often you need to go back and make changes to your data after you have entered it. You can correct and update the data quickly either by replacing the contents of an entire cell or by editing the existing content.
Слайд 26Formatting cells
You can considerably improve the look of your worksheet by using Excel’s many formatting features. Formatting your data serves a number of purposes: Helps others reviewing your data see easily what’s most important on the worksheet; Helps you organize your data so that you can easily find what you need later.
Слайд 27Example of a worksheet with some formatting
Слайд 28Predefined formats
For this purpose, you can use Excel’s predefined formats to choose a look for your cells that makes the data stand out. The cell styles available in the Styles group of the Home tab are coordinated with the theme you select for the worksheet, so all colors and fonts available are consistent with the overall theme you have chosen.
Слайд 29Formatting numbers
When you look at columns and rows full of numbers it might not be clear what those numbers represent. Are they values showing dollar amount? Are they percentages of something? You can improve the readability of your workbook by using standard numeric formatting to make everything as clear as possible for those viewing your worksheet.
Слайд 30Moving, copying, pasting
Moving, copying and pasting data is similar to the same in Word. However, when you copy data in Excel, you’ll need to have a blank area ready to receive the data; otherwise, Excel will overwrite any existing data. You can also tell Excel to copy the contents of a cell to a group of adjacent cells.
Слайд 31Live Preview
Excel 2010 includes Paste with Live Preview feature to see how your information will look when pasted using different paste options. You can choose how you want the information to be pasted both before and after you add it to your worksheet.
Слайд 32Adding and deleting columns and rows
When you add or delete several rows or columns at one time or clear all the contents of multiple rows or columns, select them before you right-click. To select nonadjacent rows or columns. Hold down the Ctrl key as you click each row or column header. To quickly clear the content of a selected cell or cells without removing any formatting, press the Delete key.
Слайд 33Hiding columns and rows
When you create a worksheet, it sometimes contains columns and rows of data that aren’t relevant for every review or for every use of the worksheet. You can suppress the display of data you do not want displayed for general view by hiding columns and rows. Late you can reveal the data once again easily to return the data to normal view.
Слайд 34To do this,
You select rows or columns and then right-click on the selected headers, and choose Hide from the shortcut menu. BUT, to make sure that you do not accidentally distribute a worksheet that contains information you do not want to share with others, make sure there are no hidden rows or columns in your final version of the workbook.
Слайд 35How?
To check for hidden rows or columns, run the Document Inspector by clicking the File tab, and then clicking Check For Issues in the Prepare Sharing group. Click Inspect Document in the list.
Слайд 36Formatting cell dimensions
You can set the Column width Row height Adjust the Height or Width to fit the content
Слайд 37Formatting Cell Dimensions
Слайд 38Preparing for Printing
Set page dimensions: On the Page Layout tab click Margin and set the ones you want to. Click the Orientation button and click either Portrait or Landscape Click the Size button, and select the paper size Specify the scaling to change the size of the printed worksheet Specify whether you want to display and/or print the gridlines and the headings
Слайд 40Creating a Data Series
Слайд 41
Слайд 42Organizing Your Worksheets
Слайд 43Inserting & Deleting a Worksheet
Слайд 44Operations in formulas
Слайд 45Formulas
When you scroll the mouse over a formula Excel will have a small dialog box that explains the purpose of each formula.
Слайд 46References
Relative Absolute Mixed References to other worksheets
Слайд 47
Слайд 48Database functions
Слайд 49Date and time functions
Слайд 51Financial functions
Слайд 52Information functions
Слайд 53Logical functions
Слайд 54Lookup and reference functions
Слайд 55Math and trigonometry functions
Слайд 56Statistical functions
Слайд 57Engineering functions External functions
Слайд 59
Слайд 60
Слайд 61
Слайд 62
 Слайд 1
 Слайд 2
 Слайд 3
 Слайд 4
 Слайд 5
 Слайд 6
 Слайд 7
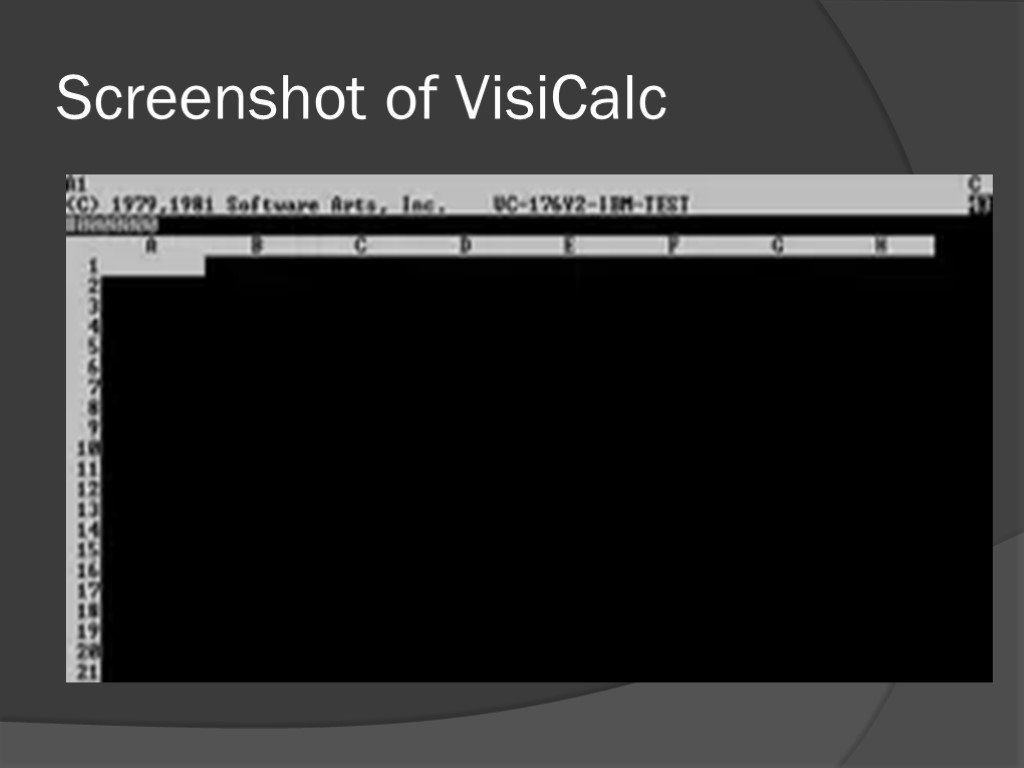 Слайд 8
 Слайд 9
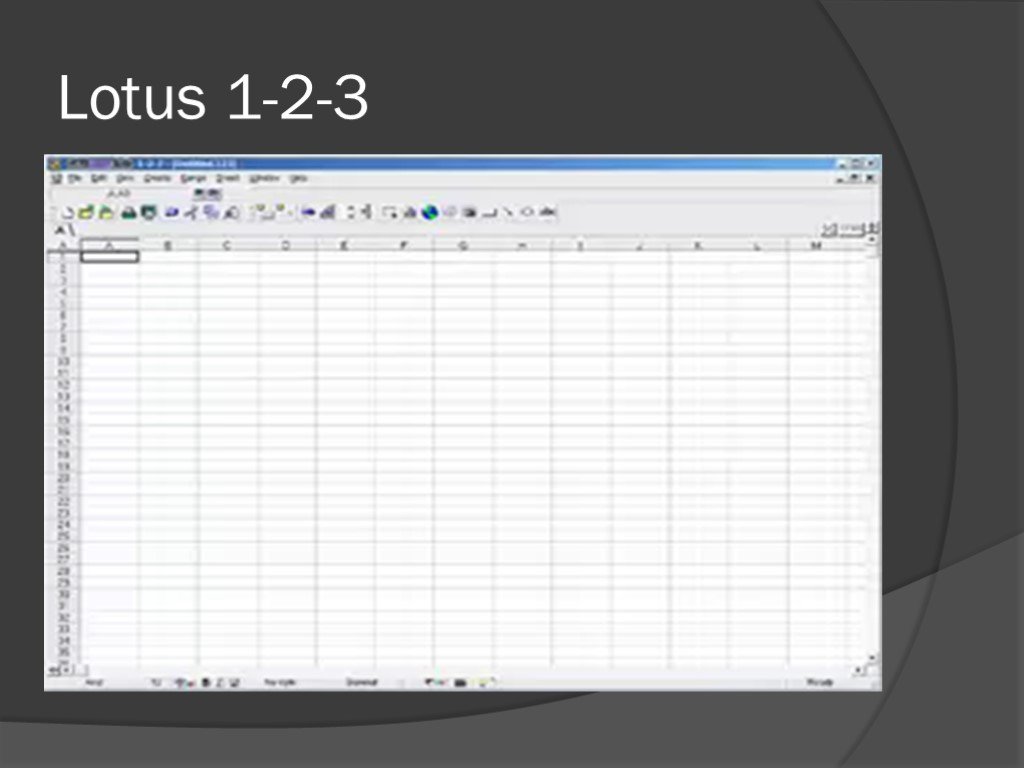 Слайд 10
 Слайд 11
 Слайд 12
 Слайд 13
 Слайд 14
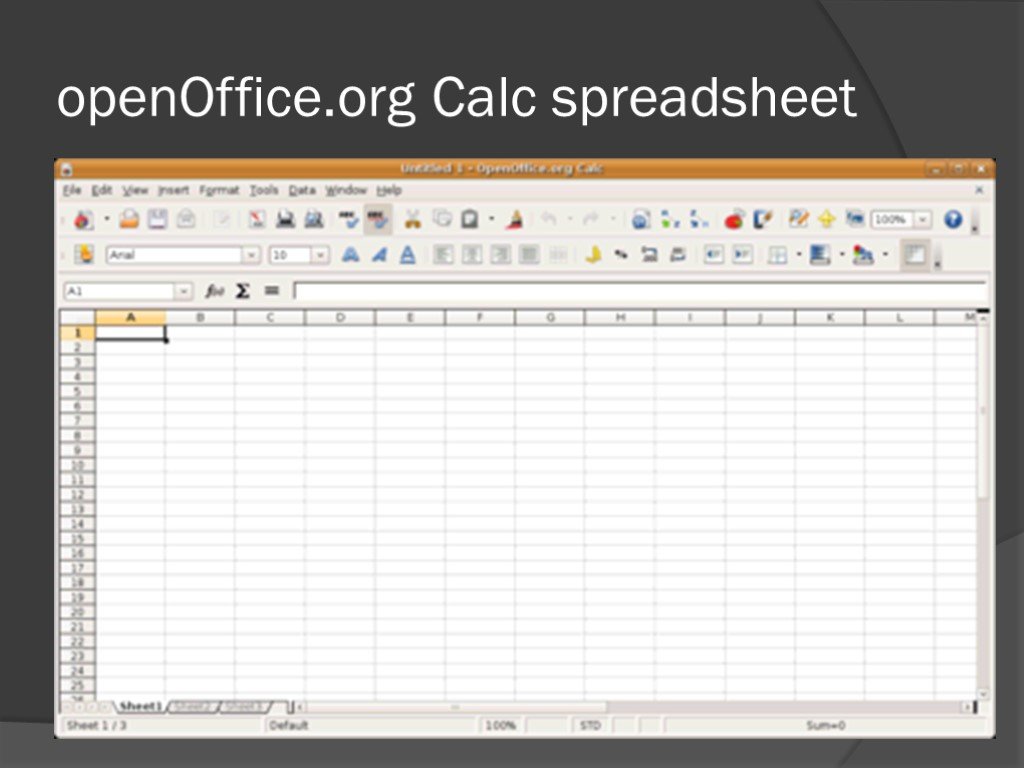 Слайд 15
 Слайд 16
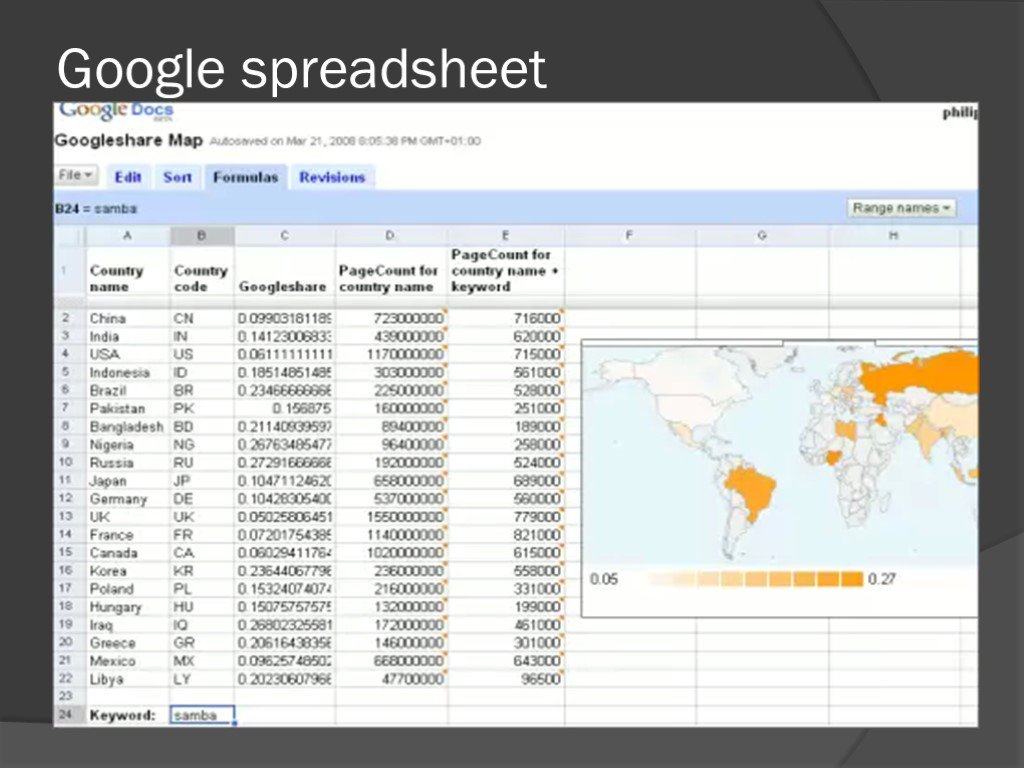 Слайд 17
 Слайд 18
 Слайд 19
 Слайд 20
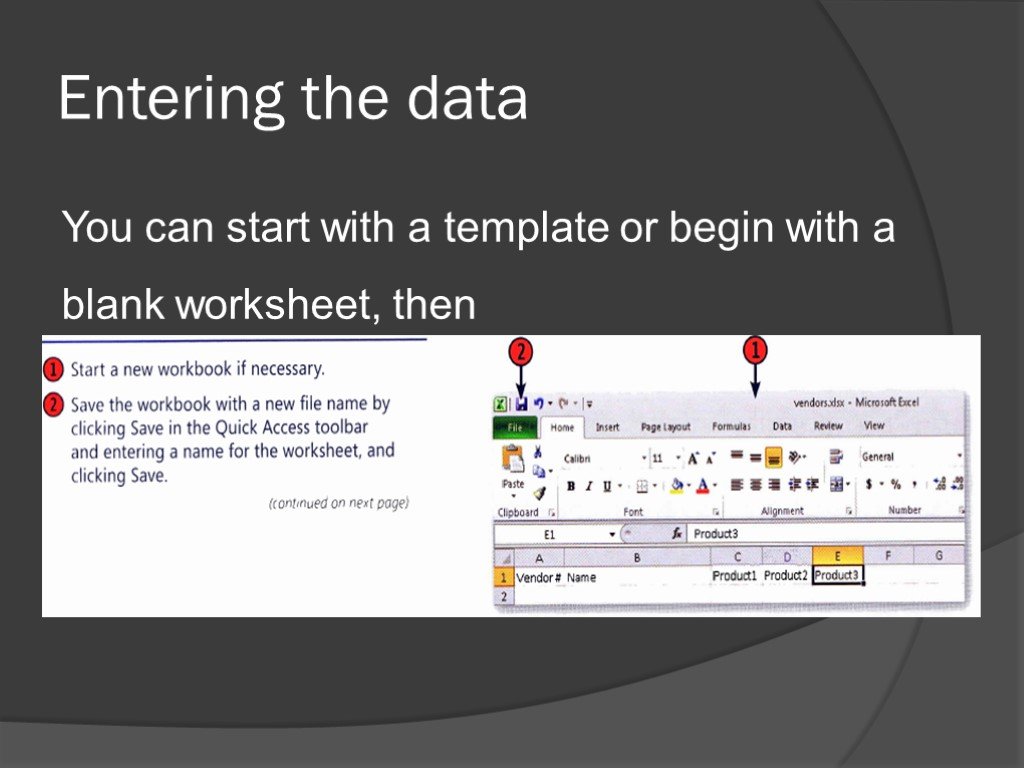 Слайд 21
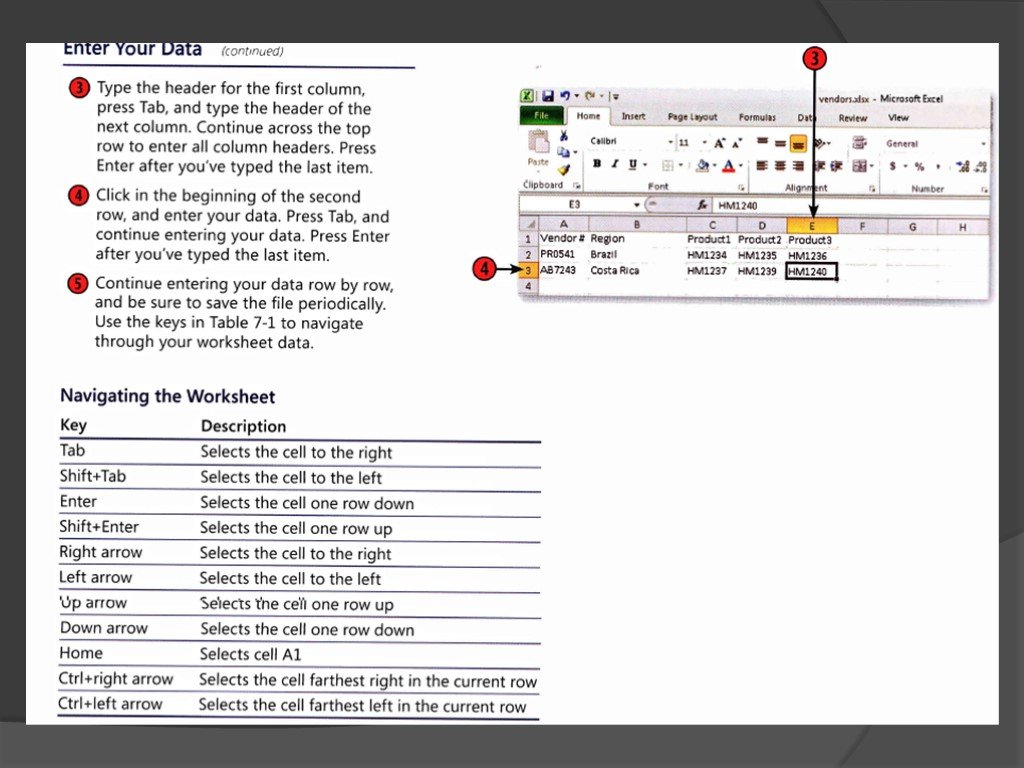 Слайд 22
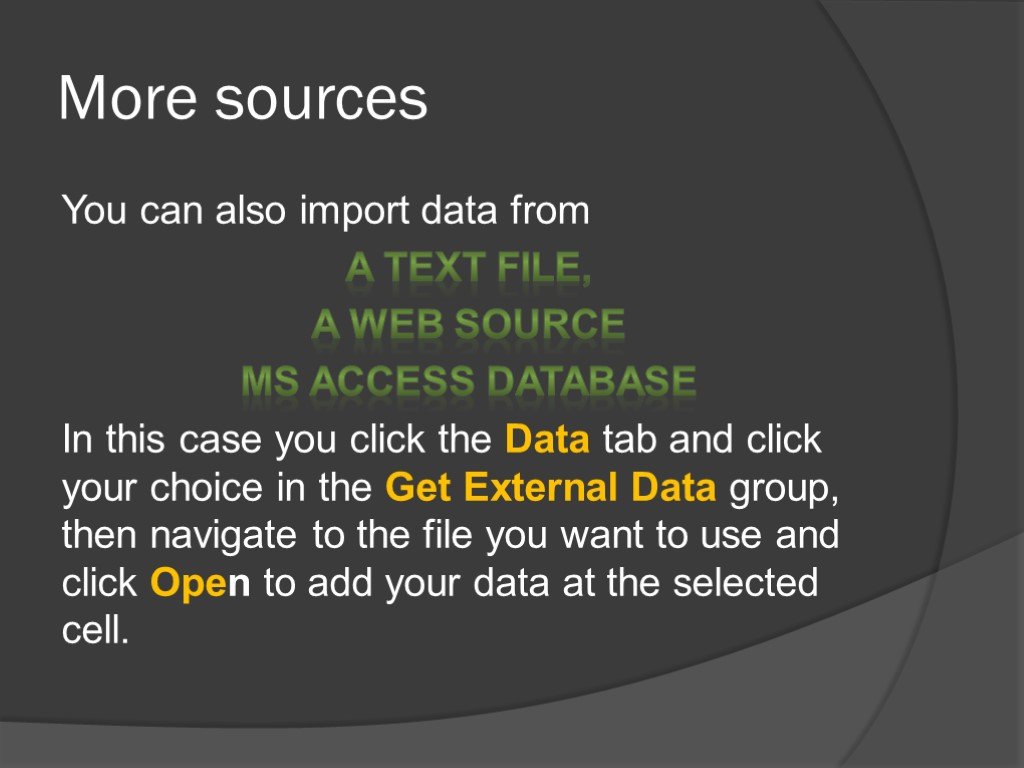 Слайд 23
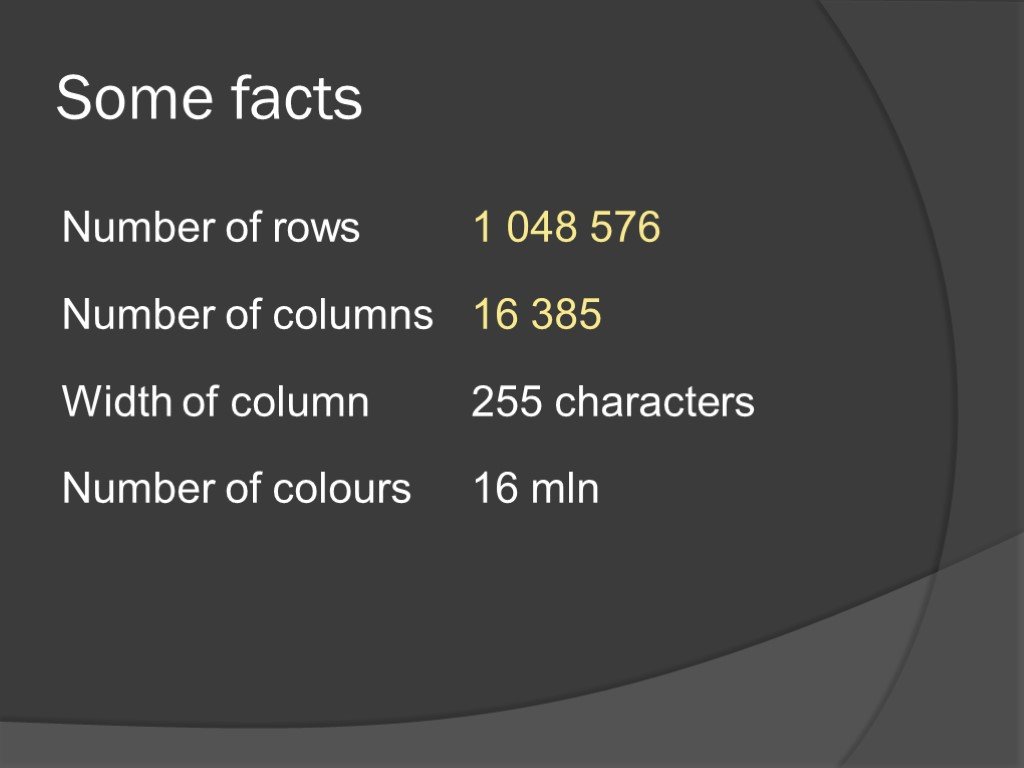 Слайд 24
 Слайд 25
 Слайд 26
 Слайд 27
 Слайд 28
 Слайд 29
 Слайд 30
 Слайд 31
 Слайд 32
 Слайд 33
 Слайд 34
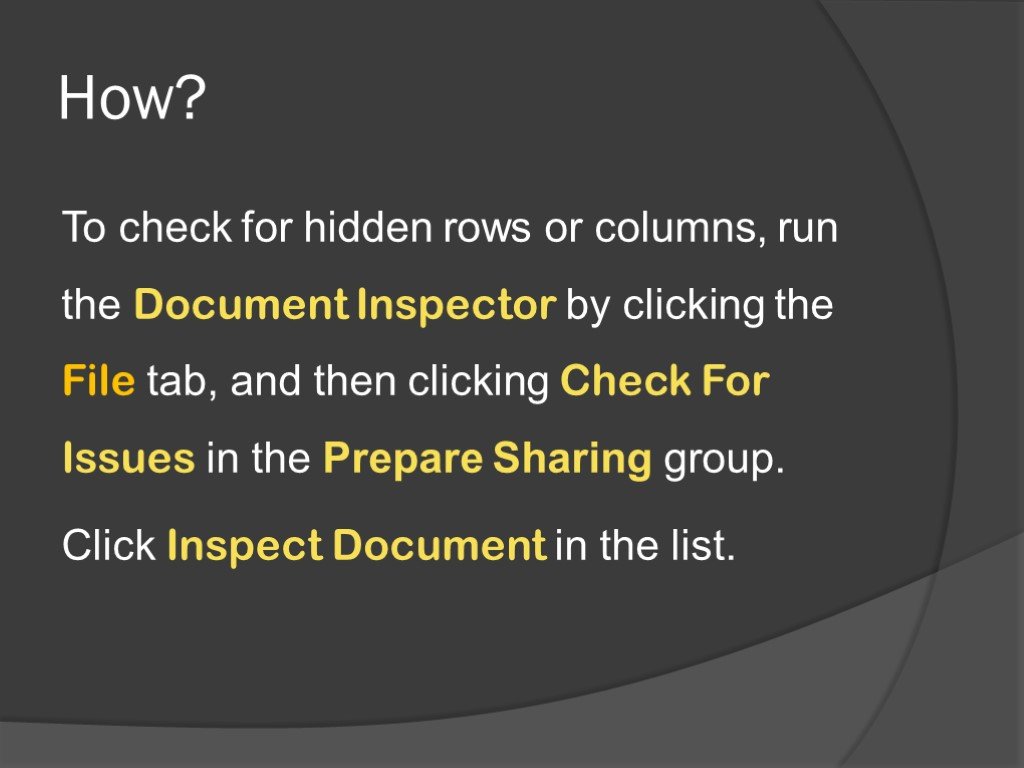 Слайд 35
 Слайд 36
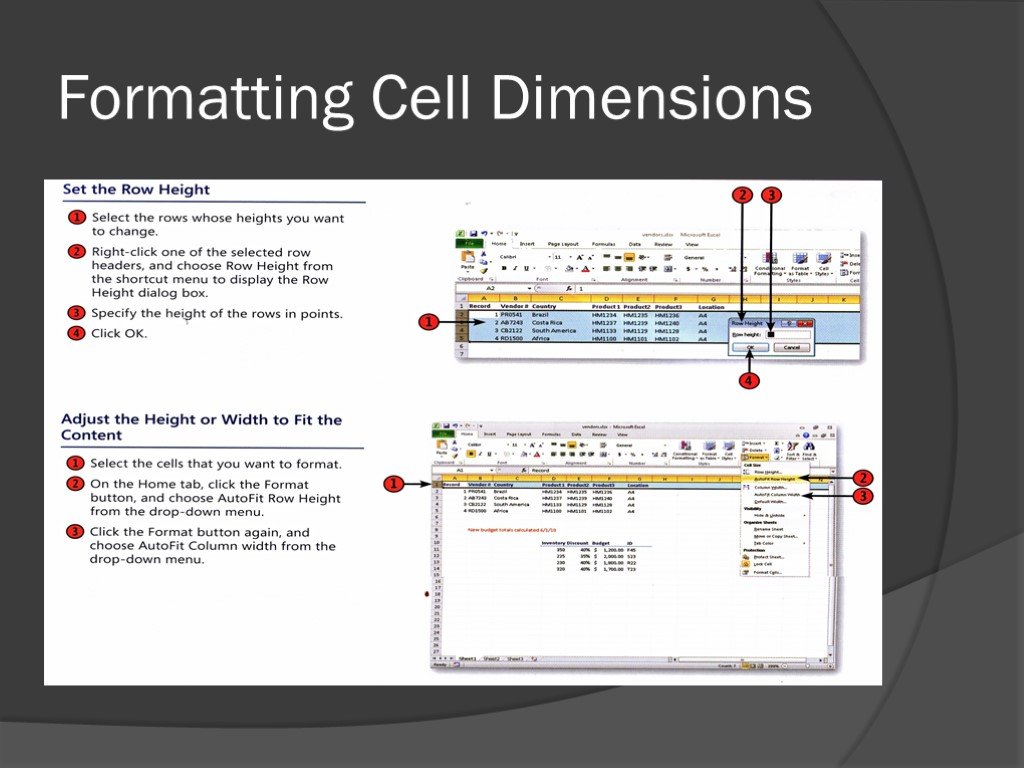 Слайд 37
 Слайд 38
 Слайд 39
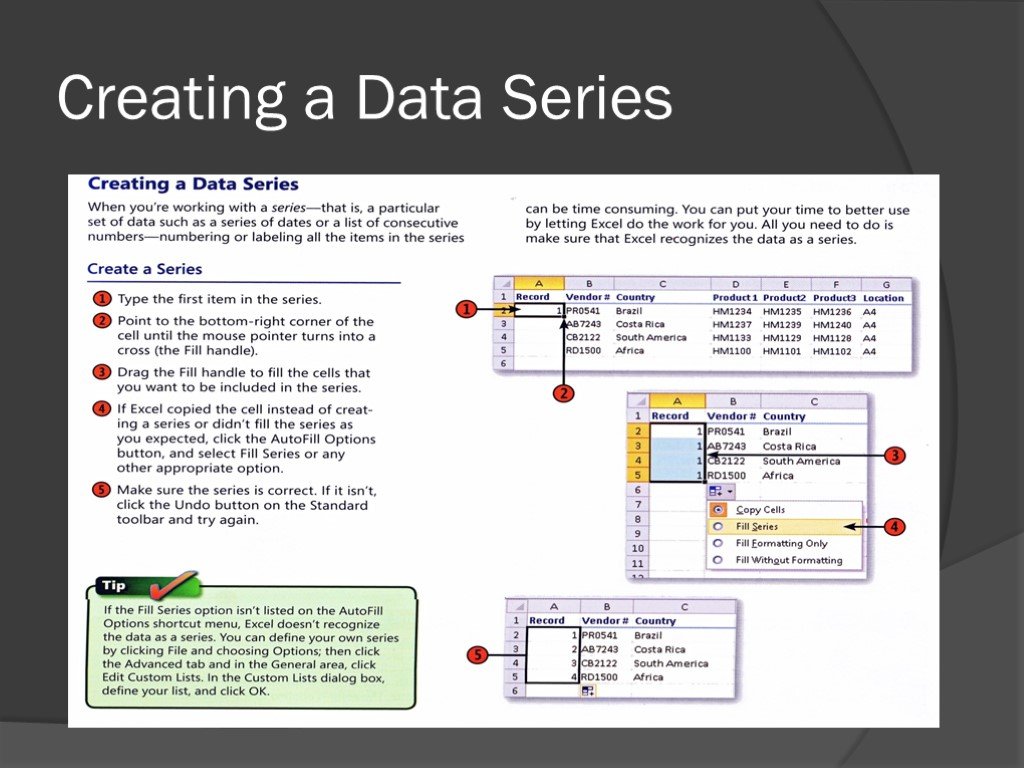 Слайд 40
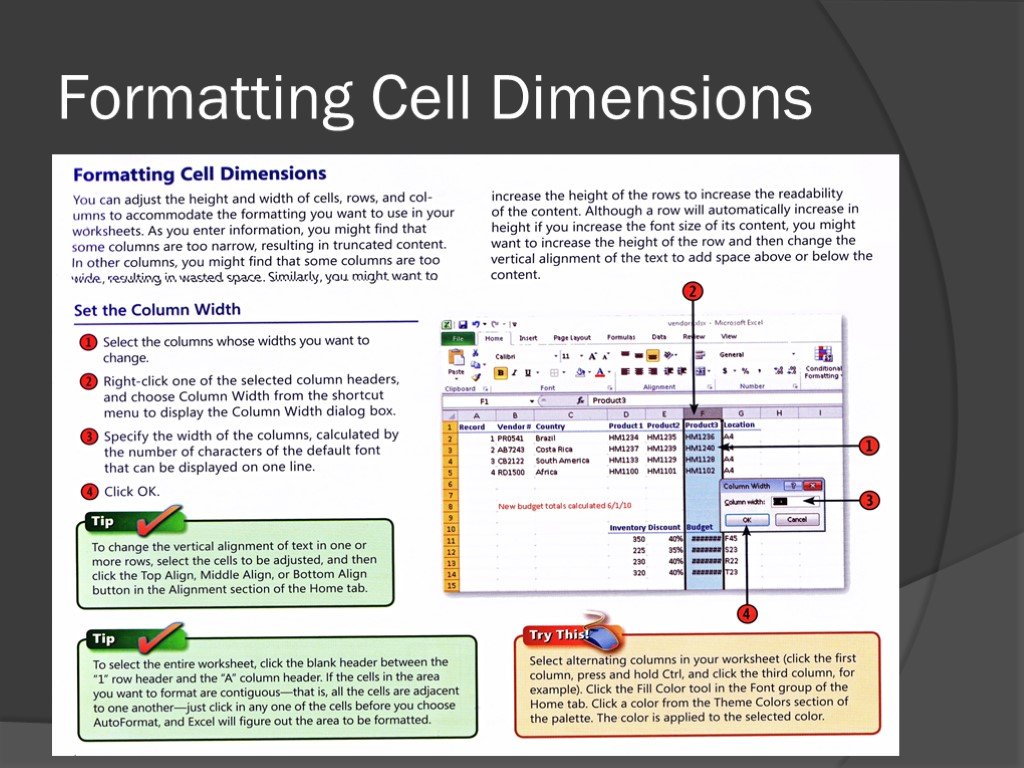 Слайд 41
 Слайд 42
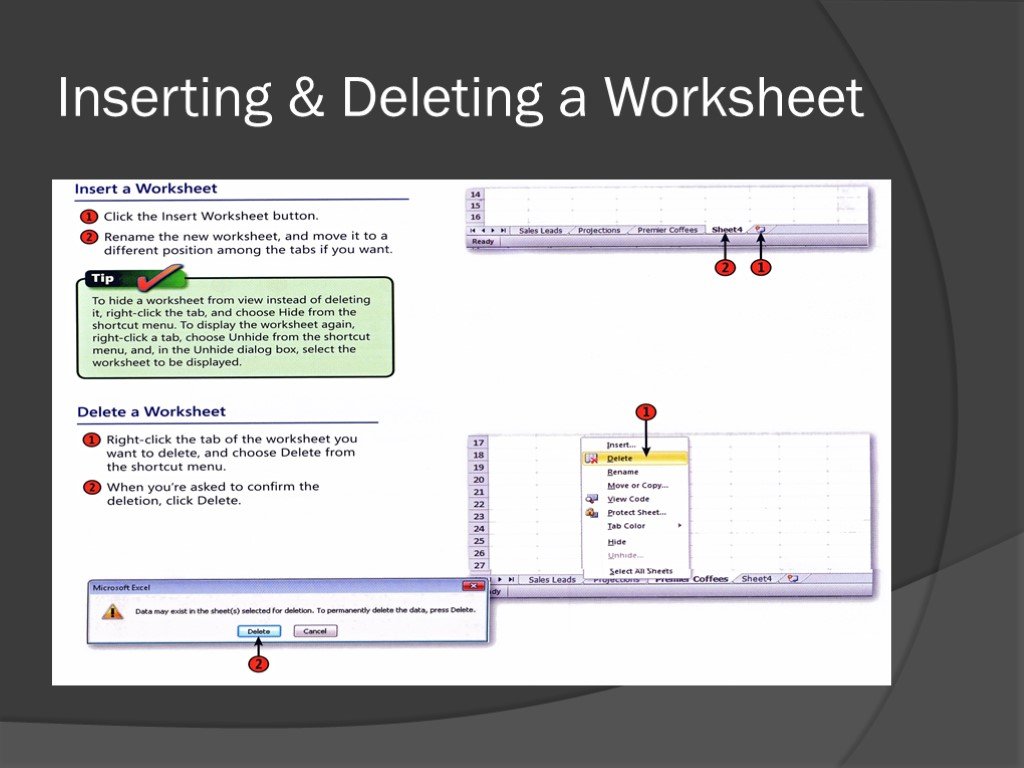 Слайд 43
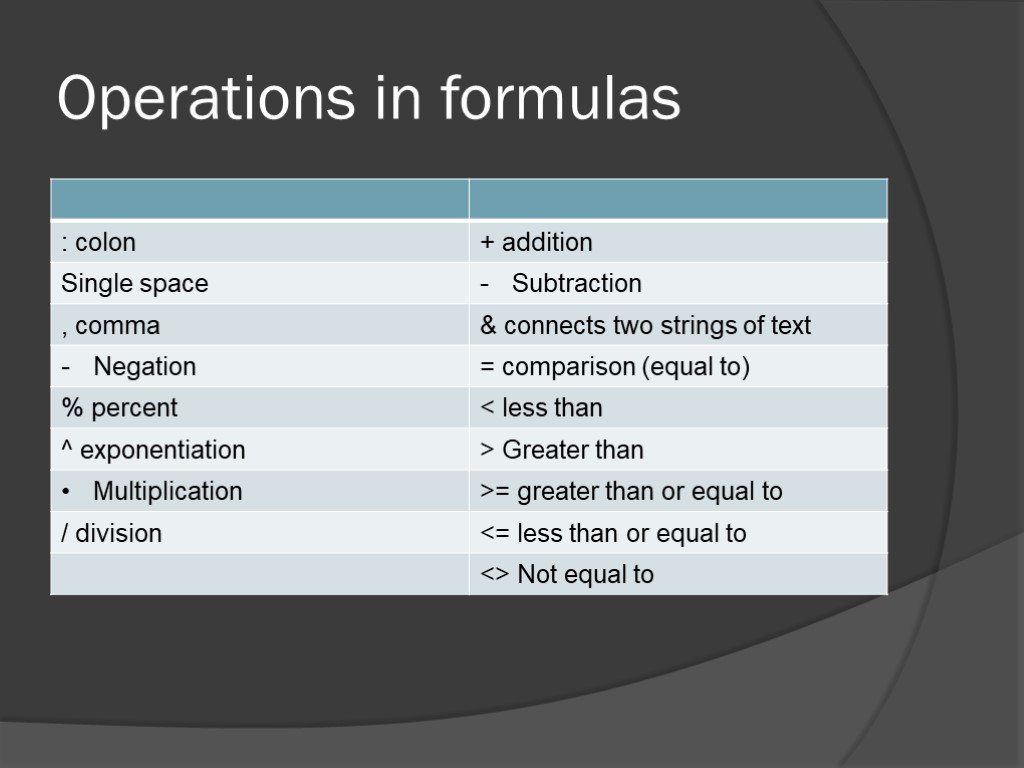 Слайд 44
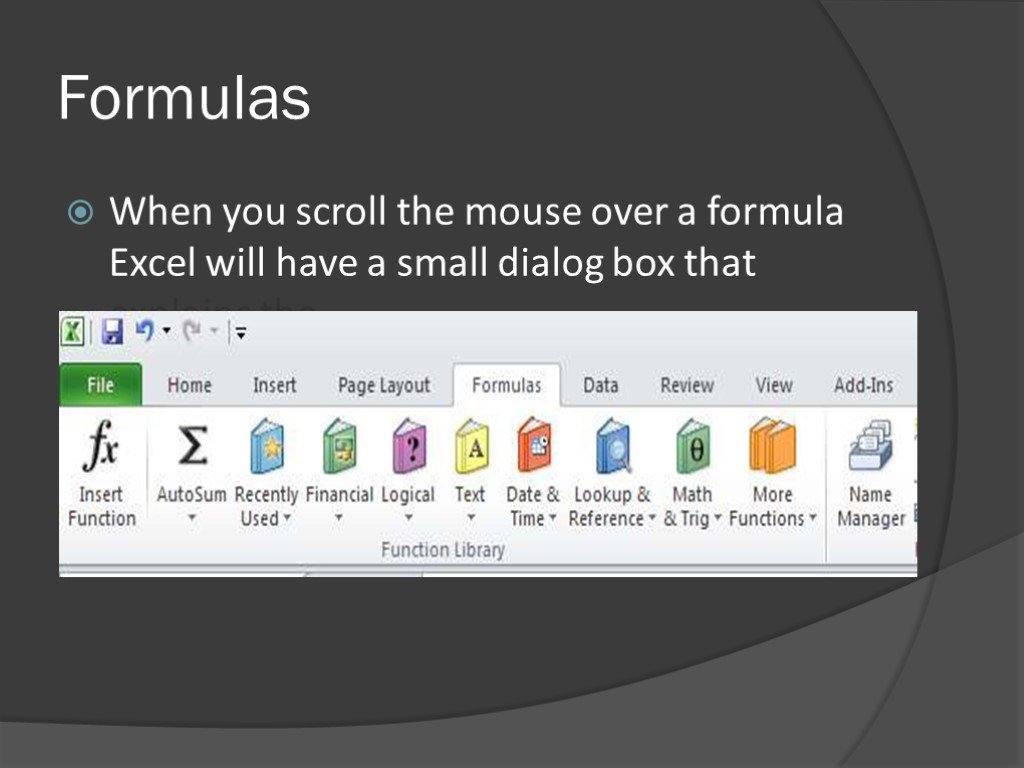 Слайд 45
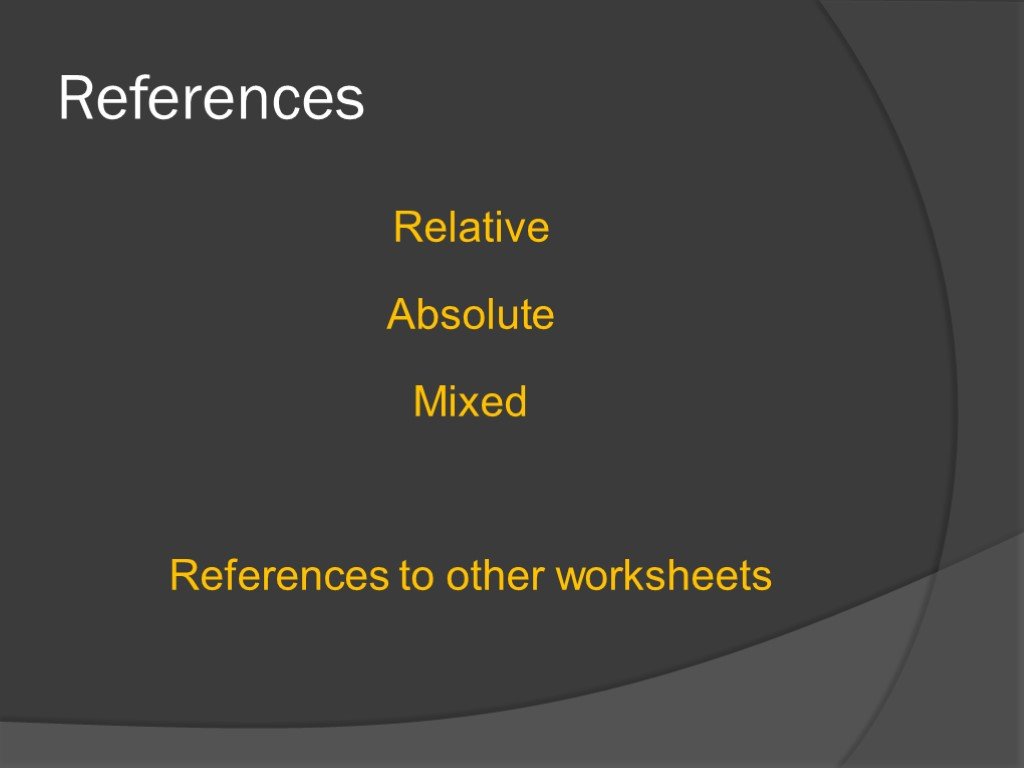 Слайд 46
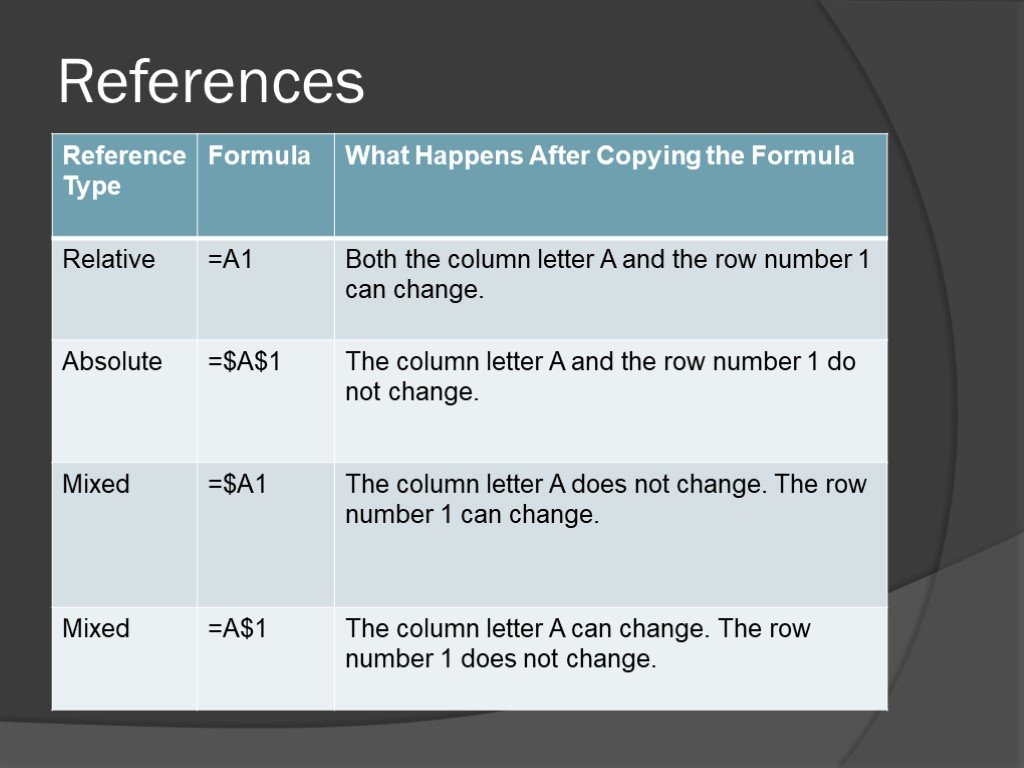 Слайд 47
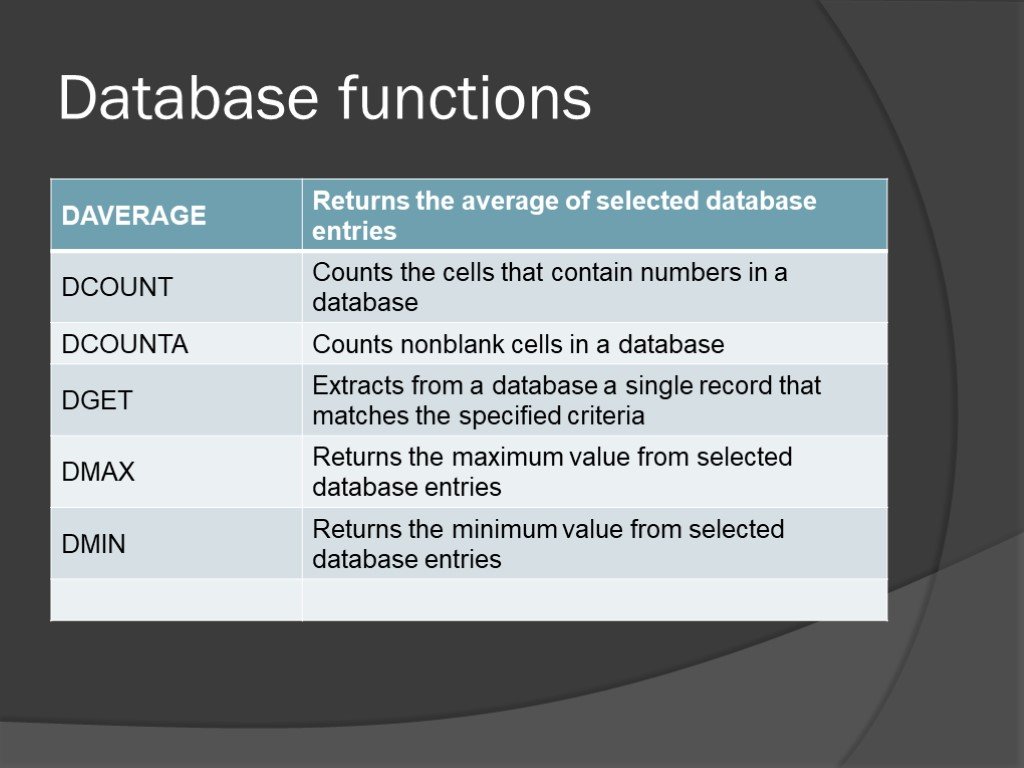 Слайд 48
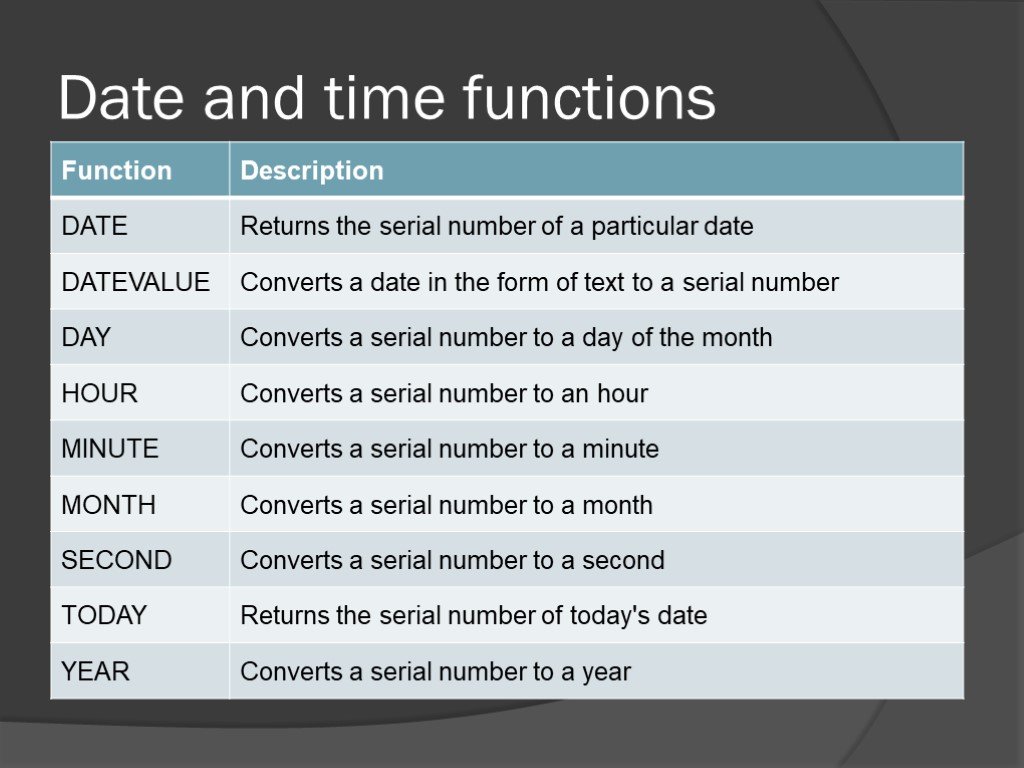 Слайд 49
 Слайд 50
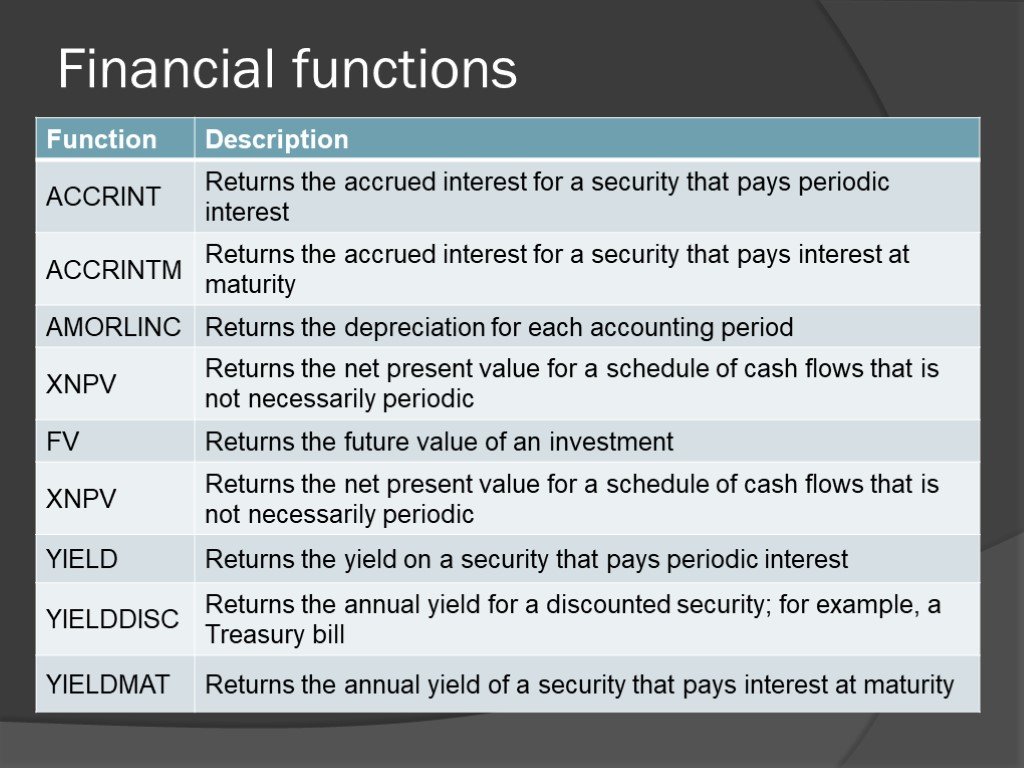 Слайд 51
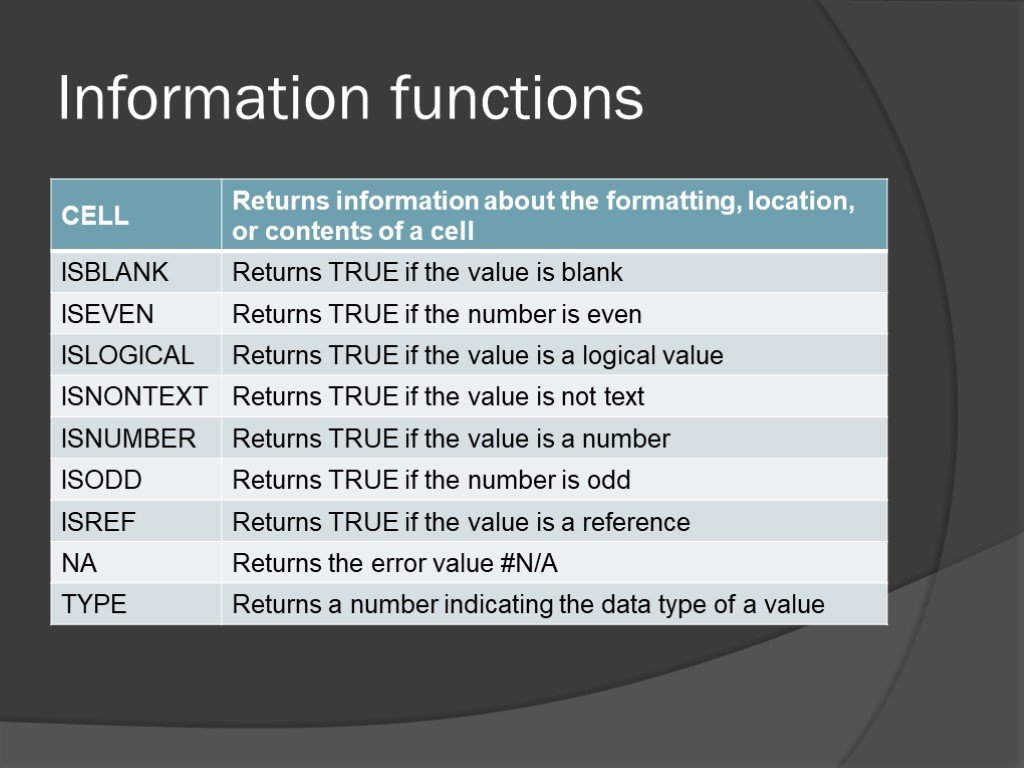 Слайд 52
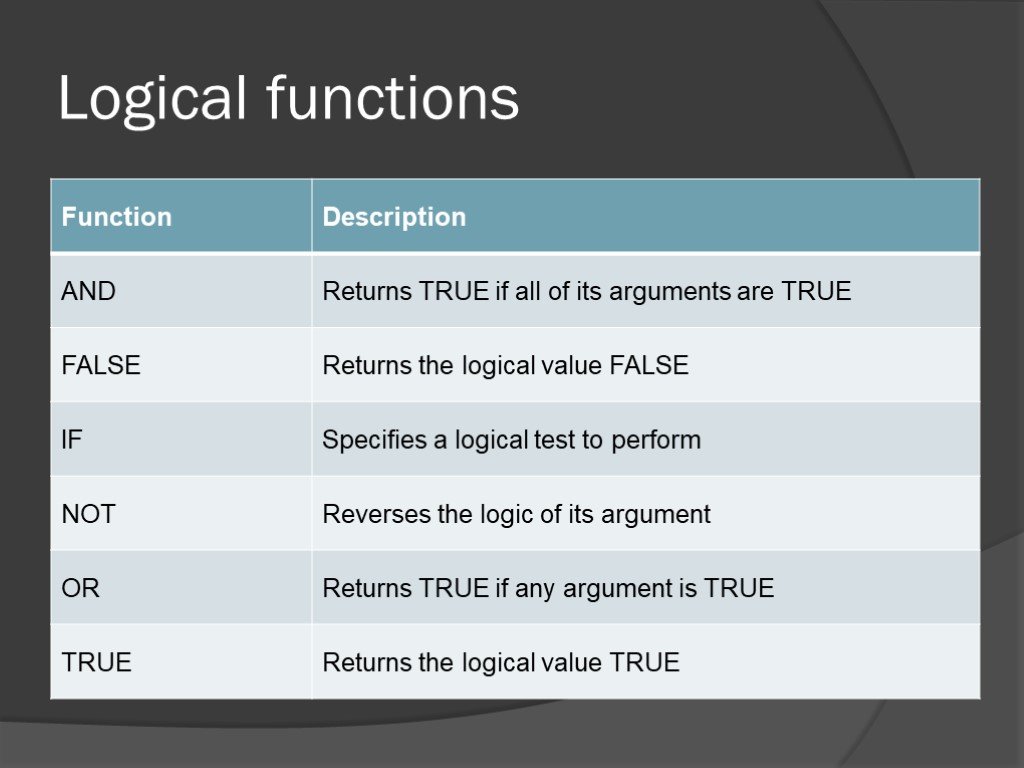 Слайд 53
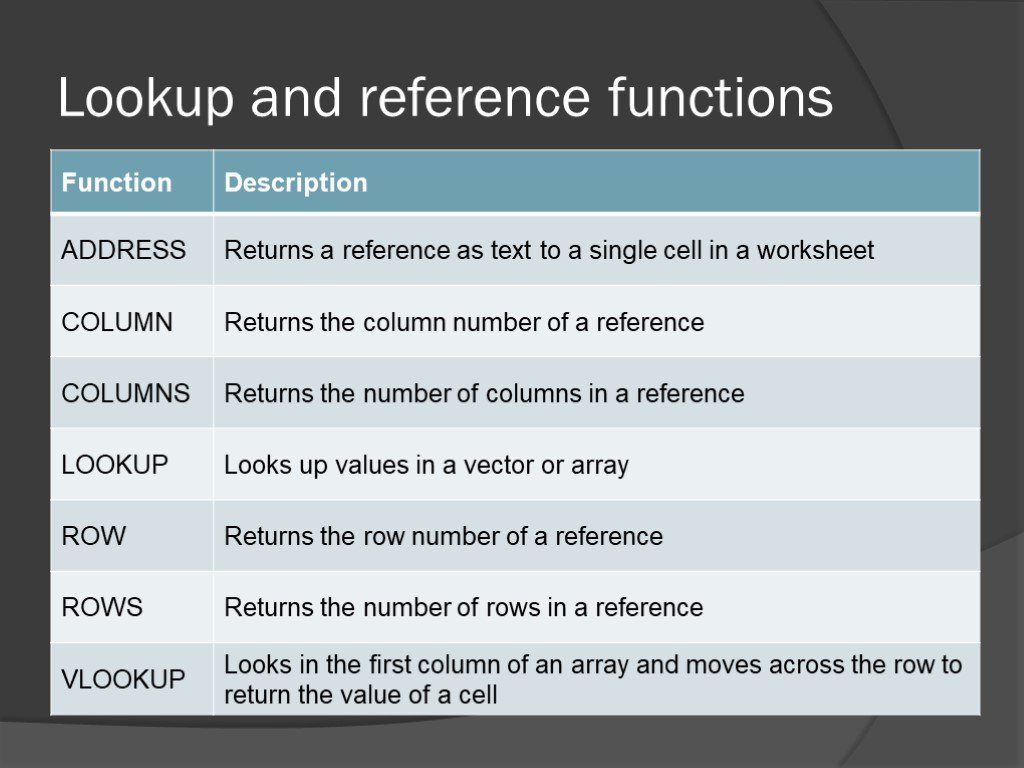 Слайд 54
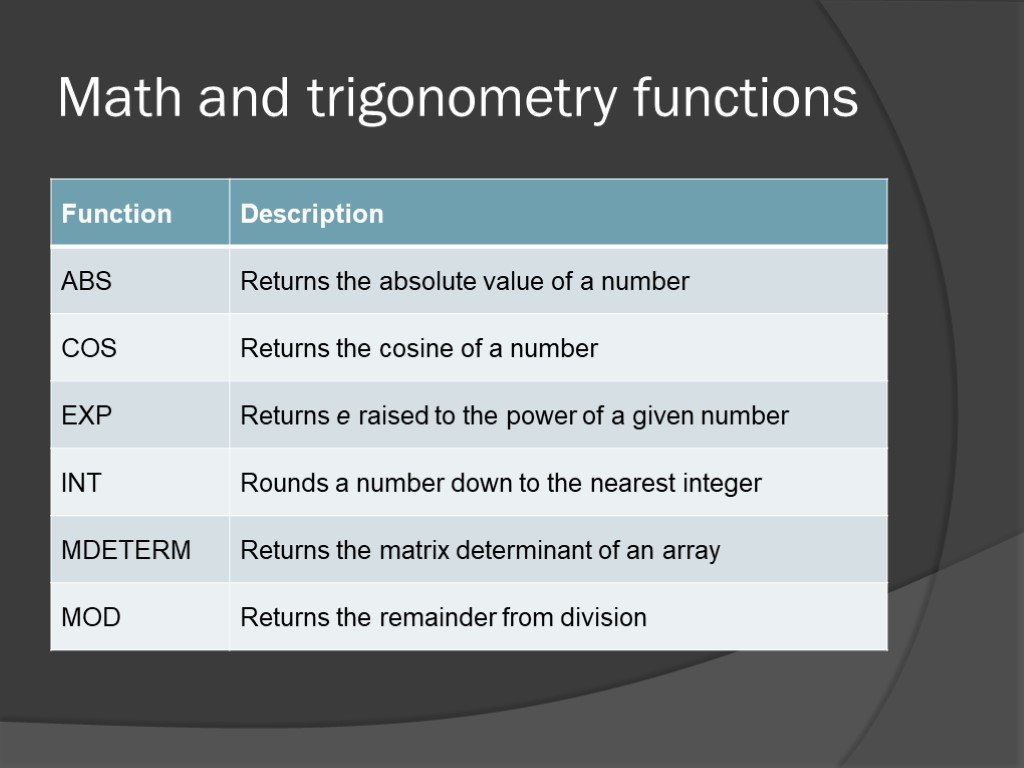 Слайд 55
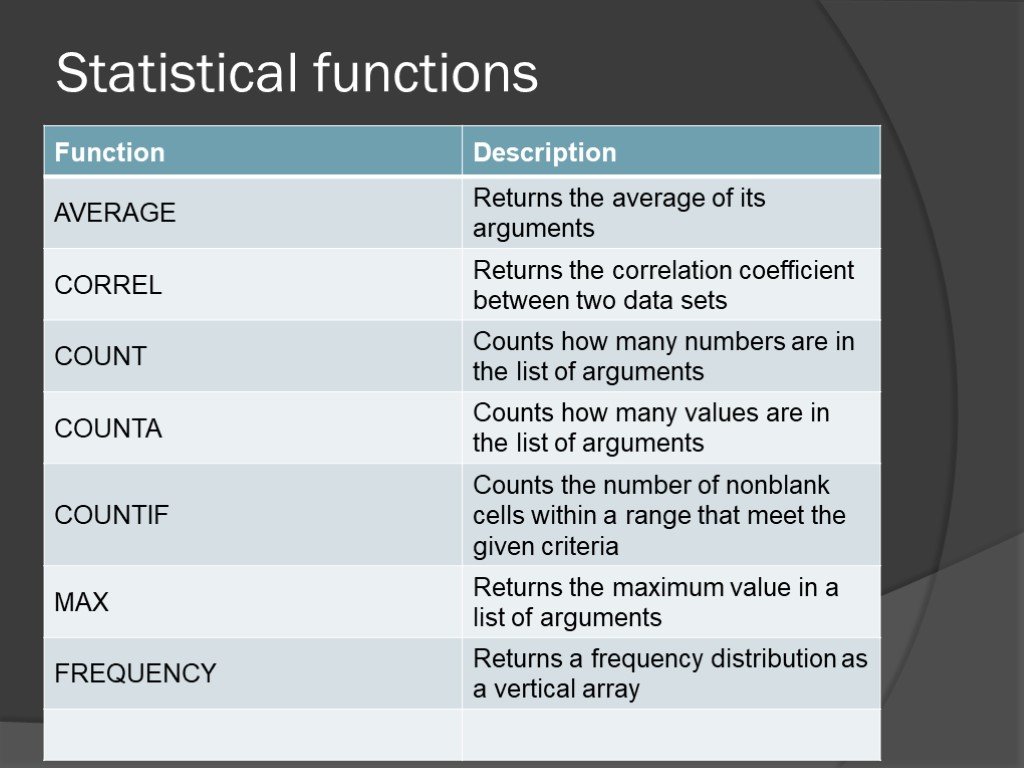 Слайд 56
 Слайд 57
 Слайд 58
 Слайд 59
 Слайд 60
 Слайд 61
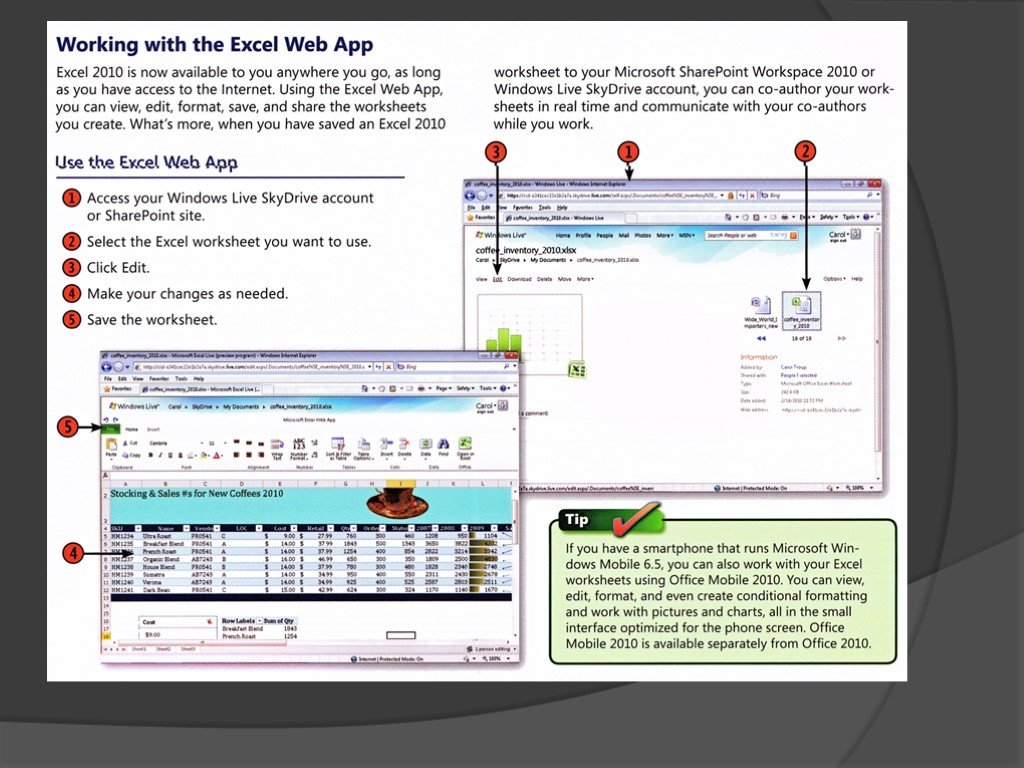 Слайд 62


")


